
College football betting research, built on the roster.
College football is where Edge Labs is built. The research runs on proprietary recruiting data, the talent a roster actually carries, and it ends in a number we hang on every priced game. Real numbers, the sample attached, the side stated.
Years of recruiting capital mapped to the roster on the field, then priced against the market line. We say which side we are on, and every lean grades against the closing number in public. Up to three free picks a week, released Tuesday, Thursday and Saturday mornings and stamped when they drop. Members see every one.
From the desk
The latest cards the desk posted · tap through for the full read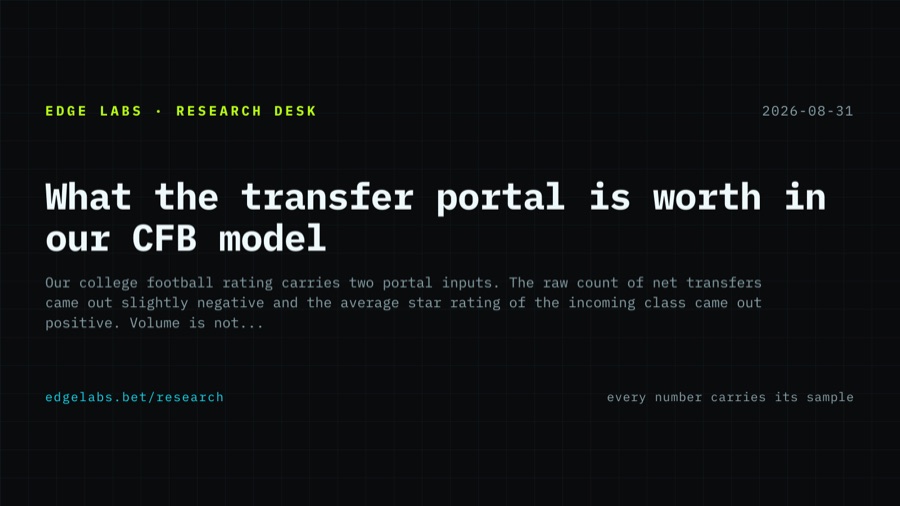
# What the transfer portal is worth in our CFB model *Our college football rating carries two portal inputs.
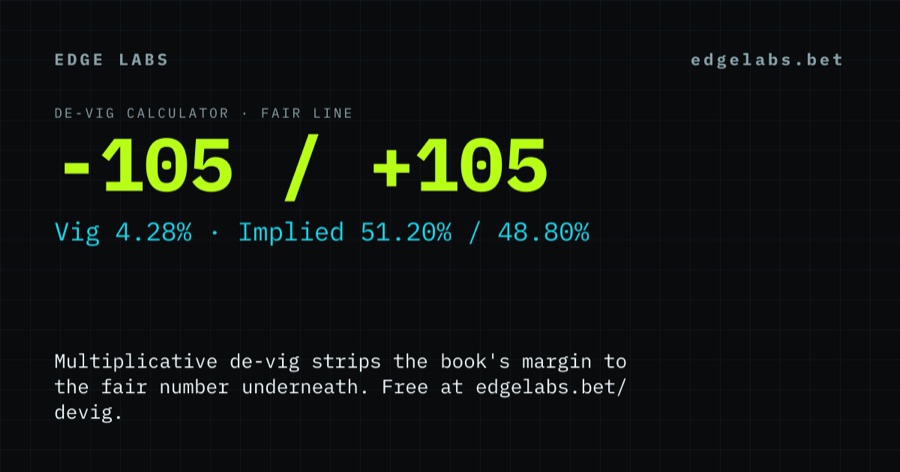
FanDuel prices Texas -115 and Ohio State -104 for their week 2 matchup, juice on both numbers.
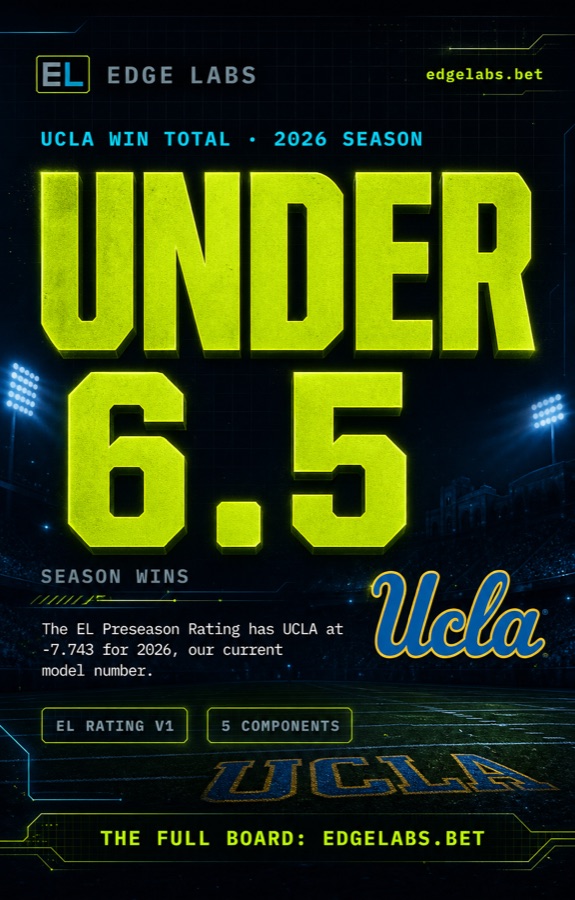
A first year head coach costs about 2.3 rating points in our model.
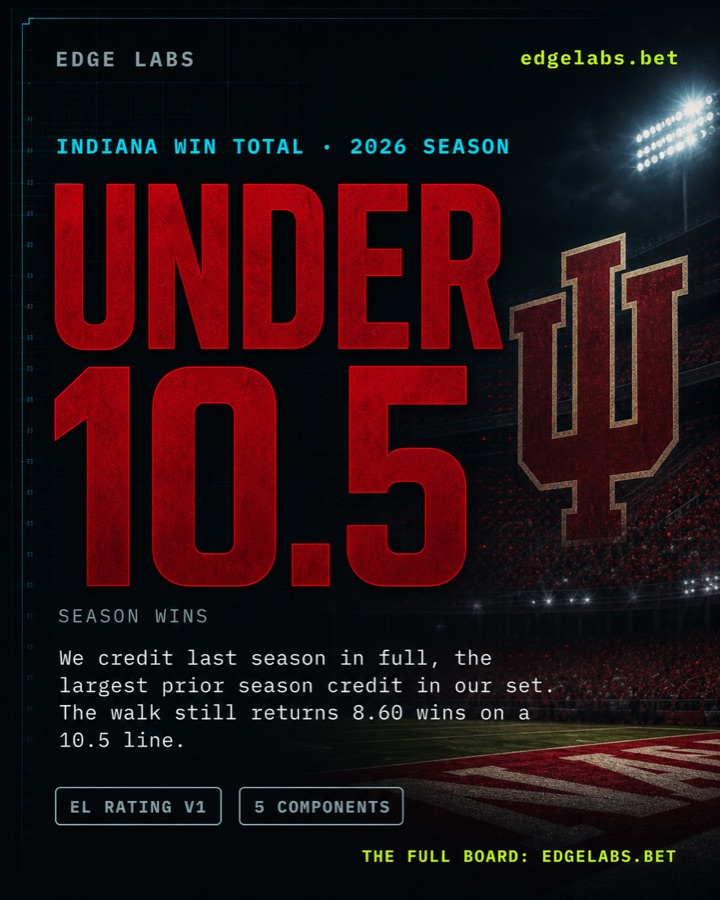
Indiana at 10.5 wins, unchanged as of 8/23 across every book we track.
The edge
What the books overlookRecruiting capital
The talent a roster actually carries, mapped across recruiting cycles and the portal. It moves our number on a game before it moves the line.
Talent vs record
The gap between the talent a team signed and what it did on the field. Who is overrated, who is underrated, surfaced from five seasons of data.
Regression signal
Recruiting talent is a leading indicator and records drift back toward the roster. We name the likely risers and fallers, and we bet them before the market catches up.
The talent intelligence
7 tools live · real data, n on every numberGames
LiveThe current week’s slate: every FBS game, the latest captured market line, our number beside it, and our lean. Up to three free picks a week, released Tuesday, Thursday and Saturday mornings and stamped when they drop; members see every one.
Open Games →Talent vs Record
LiveThe gap between the talent a team signed and what it did on the field. Who outran the roster, who got robbed, the sample on every team.
Open Talent vs Record →Power Ratings
LiveNational talent ratings straight from the four-year recruiting composite. The base input to the number we hang on every game.
Open Power Ratings →Regression Watch
LiveTalent is a leading indicator and records drift back toward the roster. This names the likely risers and fallers, and it feeds the season-long leans.
Open Regression Watch →Portal
LiveTransfer-portal influx and roster churn by program: who is reloading, who is bleeding talent, and which win totals have not caught up yet.
Open Portal →CFB Data
LiveSeason ratings, recent results, pregame ELO, and the excitement index. The base layer the talent work sits on top of.
Open CFB Data →Early-Season Totals
LiveFBS weeks 1-3 totals of 47+ went under 54.75% of the time (n=884, 2018 to 2025). We play that spot in September and every one of them grades in public.
Open Early-Season Totals →Records regress toward the roster
Across five seasons (n over 150 per side, 2020 to 2025, point-in-time), recruiting talent acts as a leading indicator. Teams that outran the talent they signed gave back about 15 win-percentage points the next season. The underrated rose about as much. That finding is the spine under the number we publish on every game.
Get the weekly board
The tools are live and the season is underway. We publish our own number on every priced game and we state the lean plainly. Up to three picks go free each week, released Tuesday, Thursday and Saturday mornings and stamped when they drop, and the record is public. Members get every lean first, plus the angles and samples behind each one.
Our leans and the work behind them, straight to your inbox. No spam. 21+.